Channel Attribution Modeling: How to Track What Actually Drives Revenue
You know your marketing channels—paid search, organic, email, paid social—generate leads. But can you say which ones drive actual revenue? Most teams can't. They credit the last click before conversion, ignore everything that came before, and end up overspending on channels that take credit without doing the work.
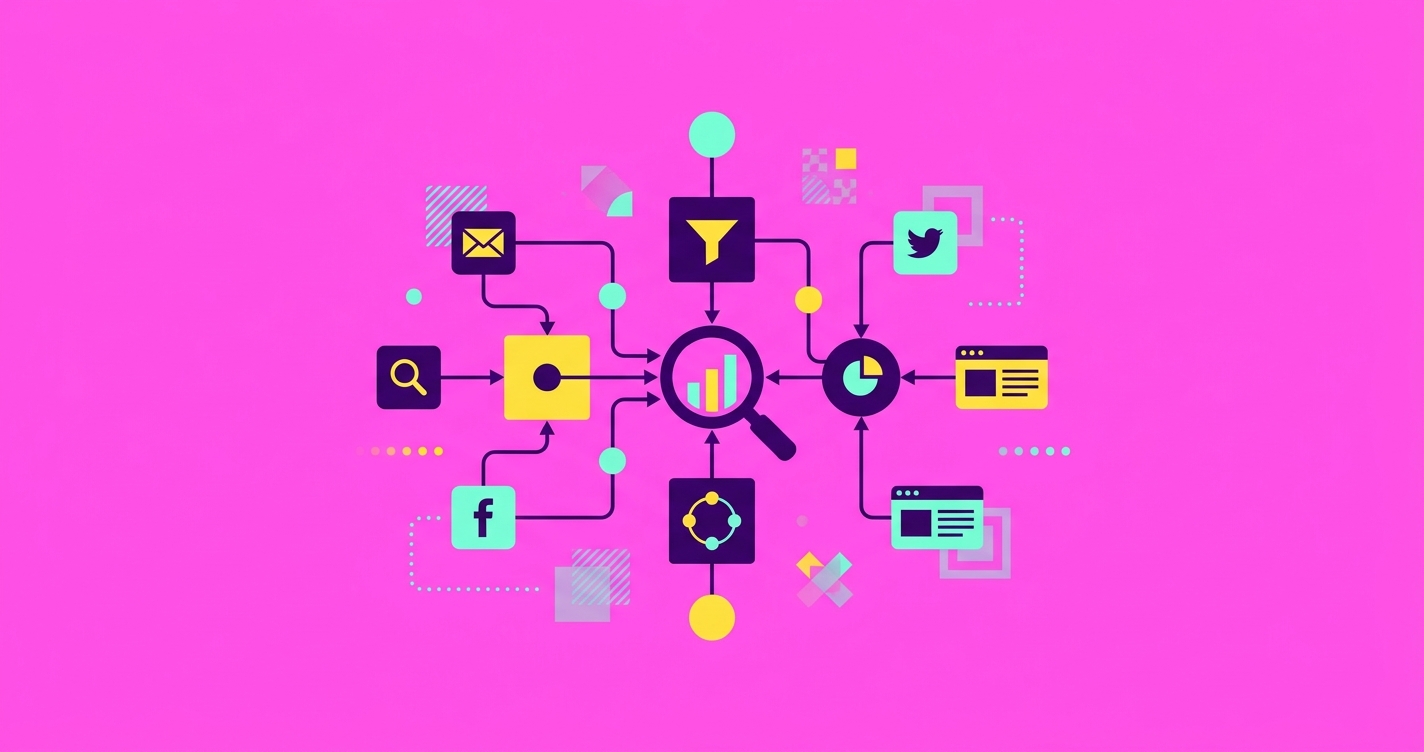
Channel attribution modeling fixes this. It's the process of assigning credit to every marketing touchpoint across the customer journey to determine which channels actually influence conversions and revenue. Instead of guessing based on last-click defaults, you see the full picture: which channels introduce prospects, which ones nurture, and which ones close.
The result: you stop wasting budget on channels that look good in reports but don't convert, and you invest more in the channels that actually work.
What Is Channel Attribution Modeling?
Channel attribution modeling is the process of assigning credit (revenue or conversion value) to marketing touchpoints across the customer journey. It tracks every interaction—organic search, paid ad click, email open, social post, webinar attendance—and determines how much each contributed to the final conversion.
Without attribution, most platforms default to last-click reporting. Your CRM says the demo request came from a paid search ad. True—but that prospect found you through organic search three weeks earlier, attended a webinar, and opened two nurture emails before clicking that ad. Last-click gives 100% credit to paid search and zero to the five touchpoints that actually built trust.
Attribution modeling distributes credit across the journey. Depending on the model you choose, you might assign equal credit to all touchpoints (linear), give more credit to the first and last (U-shaped), or let an algorithm decide based on which touchpoints correlate most with conversions (data-driven).
Here's what it reveals:
- Paid social drives discovery, but organic search closes deals.
- Email nurture has zero last-click credit but influences 60% of closed revenue.
- Branded search gets credit, but the real question is what introduced them to your brand in the first place.
Once you see the full journey, you allocate budget differently.
What should your marketing team cost in 2026?
Free calculator — answer 6 questions, get a benchmarked team cost for your stage and industry in 90 seconds.
Run my numbers →Why Channel Attribution Matters
Misattribution costs money. If you're measuring performance with last-click reporting, you're over-investing in channels that get credit by accident and under-investing in channels that do the work but never get the last click.
A 2024 Gartner study on marketing attribution found that 68% of B2B marketing budgets are misallocated due to attribution gaps. Teams pour money into bottom-funnel tactics (retargeting, branded search) because they show high conversion rates in reports. But those tactics only work because something else—content, organic search, events—introduced the prospect in the first place.
Attribution modeling shows you the difference between vanity metrics and revenue drivers:
| Vanity Metric | What It Misses | Revenue Attribution Reveals |
|---|---|---|
| Last-click conversion rate | All prior touchpoints | Which channels drive discovery vs. which close |
| Channel-specific ROI | Multi-touch influence | How channels work together across the funnel |
| Campaign performance in isolation | Cross-channel journey | Which campaigns assist vs. which get final credit |
| High conversion from branded search | What made them aware of your brand | True top-of-funnel channel effectiveness |
The second you switch from last-click to multi-touch attribution, budget allocation changes. You stop spending on channels that take credit and start spending on channels that build pipeline.
For growing companies, this matters even more. When you're scaling from $2M to $10M, every dollar of marketing spend has to prove ROI. Attribution modeling is how you prove it.
6 Attribution Models Explained
There are six core attribution models. Each one distributes credit differently across the customer journey. The right model depends on your sales cycle length, number of touchpoints, and how much data you have.
Here's how each one works:
| Model | How It Works | Best For |
|---|---|---|
| First-Touch Attribution | 100% credit to the first touchpoint that introduced the prospect | Brand awareness campaigns, top-of-funnel measurement |
| Last-Touch Attribution | 100% credit to the final touchpoint before conversion | Short sales cycles (e-commerce, transactional B2C) |
| Linear Attribution | Equal credit to every touchpoint in the journey | Long sales cycles with many touchpoints (6+ month B2B deals) |
| Time-Decay Attribution | More credit to touchpoints closer to conversion, less to earlier ones | Sales cycles where recent activity matters most |
First-touch attribution answers: what introduced them? If you run a brand awareness campaign and want to measure top-of-funnel impact, first-touch shows which channels drive discovery. The risk: it gives zero credit to everything that nurtured them toward a decision.
Last-touch attribution is what most platforms default to. Google Analytics, Facebook Ads, and most CRMs report last-click conversions. It works for short sales cycles—someone searches "buy running shoes," clicks an ad, and buys. But for B2B deals with 6-12 month cycles and 15+ touchpoints, last-touch is misleading.
Linear attribution splits credit equally. If a prospect touched five channels before converting, each gets 20%. This works when you want a balanced view and don't want to over-credit any single touchpoint. The downside: it assumes every touchpoint contributes equally, which isn't true—discovery matters more than a random email open.
Time-decay attribution weights recent touchpoints more heavily. The logic: touchpoints closer to conversion had more influence. This makes sense for sales cycles where momentum matters, but it undervalues the top-of-funnel work that started the relationship.
U-shaped attribution gives 40% credit to first touch (discovery), 40% to last touch (conversion), and splits the remaining 20% across middle touchpoints. It's a compromise—you credit both introduction and close, while acknowledging that nurture happened in between. The downside: the 40/40/20 split is arbitrary.
Data-driven attribution uses machine learning to assign credit based on patterns in your conversion data. If the algorithm sees that webinar attendance correlates more strongly with closed deals than email opens, it assigns more credit to webinars. This is the most accurate model—if you have enough data (1,000+ conversions per month). For smaller teams, you don't have the volume to train the algorithm.
Most companies start with linear or U-shaped attribution and move to data-driven once they hit scale.
The Freelance Revolution Report
How thousands of companies are building hybrid marketing teams — data from 30,000+ MarketerHire hires. Free PDF.
Get the full report →How to Choose the Right Attribution Model
Choosing the right model comes down to four factors: sales cycle length, touchpoint count, team analytics maturity, and data quality.
1. Sales cycle length
Short cycles (0-7 days): Last-touch works. E-commerce, lead-gen landing pages, transactional B2C—most conversions happen in one or two sessions. Last-click is close enough to reality.
Medium cycles (1-3 months): Linear or U-shaped. Prospects touch multiple channels (organic search, paid ads, email, retargeting). You want to credit discovery and close, plus acknowledge nurture in between.
Long cycles (3-12+ months): Linear, time-decay, or data-driven. B2B SaaS, enterprise deals, high-ticket services—these journeys span months and dozens of touchpoints. Last-touch would give 100% credit to a retargeting ad when the real work happened in content, events, and sales outreach.
2. Touchpoint count
1-3 touchpoints: Last-touch is fine. You're not missing much.
4-10 touchpoints: Linear or U-shaped. You want to credit the full journey without over-engineering.
10+ touchpoints: Data-driven or time-decay. Manual models (linear, U-shaped) treat all touchpoints the same, which breaks down when someone attends three webinars, downloads two whitepapers, and clicks five ads.
3. Team analytics maturity
Early-stage teams (no dedicated analytics hire): Start with linear. It's simple, defensible, and better than last-click. You can explain it to your CEO in one sentence.
Mid-stage teams (marketing ops or analyst on staff): U-shaped or time-decay. You have the bandwidth to interpret results and adjust spend based on position-based credit.
Mature teams (analytics team, data infrastructure, 1,000+ monthly conversions): Data-driven. You have the data volume and technical capacity to let an algorithm optimize.
4. Data quality
Tracking gaps (missing UTM parameters, offline touchpoints not logged, dark social): Start simple. Linear attribution with clean data beats data-driven attribution with garbage data.
Clean tracking (UTMs on every link, CRM integration, offline events logged): You can use any model. Your data supports it.
Most teams pick linear or U-shaped and stick with it for 6-12 months before revisiting.
Setting Up Attribution Modeling (Step-by-Step)
Here's how to implement attribution modeling from scratch:
Step 1: Define goals and KPIs
What are you measuring—revenue, leads, or engagement? For most B2B companies, the goal is closed revenue. For lead-gen businesses, it's qualified leads. For content businesses, it might be email signups.
Pick one. Attribution models assign credit to conversions. If you're measuring five different conversion types, you'll need five different models (or one model with weighted conversion values).
Step 2: Map your customer journey
List every touchpoint a prospect might hit from awareness to conversion:
- Awareness: organic search, paid social, content, PR, word-of-mouth
- Consideration: webinars, case studies, product pages, email nurture
- Decision: demo requests, sales calls, pricing page visits, retargeting
Identify which channels you can track (digital) and which you can't (offline events, dark social, direct referrals). You'll need workarounds for offline touchpoints—unique URLs, call tracking, post-sale surveys.
Step 3: Choose your attribution model
Use the decision framework from the previous section. For most growing B2B companies: start with linear or U-shaped.
Step 4: Select and configure tools
You have three options:
- Free: Google Analytics 4. Built-in attribution models (last-click, first-click, linear, time-decay, data-driven if you have enough volume). Works if your entire journey happens online and you're tracking UTM parameters.
- CRM-integrated: HubSpot Marketing Hub, Salesforce Marketing Cloud. Connects marketing touchpoints to closed deals in your CRM. Required for B2B attribution—you need to tie touches to revenue, not just leads.
- Dedicated platform: Ruler Analytics, Bizible (Adobe), Dreamdata, HockeyStack. These specialize in multi-touch attribution with call tracking, offline event logging, and custom model builders.
Most teams start with GA4 or HubSpot. If you're tracking offline touchpoints or complex B2B journeys, upgrade to a dedicated platform.
Step 5: Test, validate, and iterate
Run your attribution model for 30-60 days, then compare attributed revenue to actual closed revenue in your CRM. Do the numbers match? If attributed revenue is 30% higher than closed revenue, your model is double-counting or your conversion tracking is broken.
Validate by channel: does the attributed revenue for paid search match what your ads platform reports? If GA4 says paid search drove $100K in attributed revenue but Google Ads reports $50K, one of your tracking setups is wrong.
Once validated, review quarterly. Sales cycles change. Channels shift. A model that worked in Q1 might need adjustment by Q4.
Best Attribution Modeling Tools
Here's a comparison of the most common attribution tools:
| Tool | Price Tier | Best For |
|---|---|---|
| Google Analytics 4 | Free | Small teams, online-only journeys, budget-conscious startups |
| HubSpot Marketing Hub | $$ ($800-3,200/mo) | B2B teams using HubSpot CRM, multi-touch attribution tied to deals |
| Salesforce Marketing Cloud | $$$$ ($1,250-15,000+/mo) | Enterprise B2B, complex sales cycles, existing Salesforce users |
| Ruler Analytics | $$ (starting ~$199/mo) | Businesses tracking phone calls + web, agencies managing multiple clients |
How to choose:
- Budget under $500/month: Start with Google Analytics 4. It's free and handles most use cases if your tracking is clean.
- B2B with CRM (HubSpot or Salesforce): Use the attribution features built into your CRM. You need closed-loop reporting (marketing touchpoint → deal closed), which requires CRM integration.
- Tracking offline conversions (calls, events, in-person): Ruler Analytics or similar call-tracking platforms. GA4 can't track phone calls without custom setup.
- Enterprise scale (10,000+ monthly conversions, custom models): Adobe Analytics, Salesforce, or build custom with a data warehouse + BI tool.
Most growing companies start with GA4 or HubSpot, then upgrade to a dedicated platform when offline tracking or custom models become necessary.
Common Attribution Mistakes to Avoid
Even with the right model and tools, most teams make these five mistakes:
1. Using last-touch attribution for long sales cycles
If your B2B sales cycle is 6+ months with 15 touchpoints, last-touch attribution is fiction. The "converting" touchpoint gets 100% credit while the webinar that introduced them, the case study that built trust, and the nurture emails that kept them engaged get zero.
Fix: Switch to linear or U-shaped attribution. Even a rough multi-touch model beats last-click for complex journeys.
2. Ignoring offline touchpoints
If you run events, send direct mail, or take phone calls, those touchpoints aren't in Google Analytics by default. Your attribution model only sees digital touches—and gives them credit for offline work.
Fix: Use call tracking (Ruler, CallRail), unique landing pages for direct mail, or post-sale surveys asking "How did you hear about us?"
3. Not accounting for dark social
When someone shares your content in Slack, iMessage, or LinkedIn DM, the click shows up as "direct" traffic in analytics. Your attribution model has no idea they came from a social share.
Fix: You can't track dark social perfectly, but you can reduce misattribution by using UTM parameters on all shareable links and analyzing traffic spikes correlated with social posts.
4. Over-crediting branded search
Branded search (searches for your company name) converts at 40-60%. Attribution models love it. But branded search only works because something else made them aware of your brand. Giving last-touch credit to branded search hides the top-of-funnel channel that introduced them.
Fix: Use first-touch or U-shaped attribution to see what drove brand awareness. Or filter branded search out of your attribution reports and analyze it separately.
5. Setting and forgetting
Your attribution model isn't permanent. Sales cycles shift. You launch new channels. What worked in Q1 might not work in Q4.
Fix: Review your attribution model quarterly. Are the credit splits still accurate? Are you tracking new channels? Does attributed revenue still match closed revenue?
Most attribution problems come from one of these five mistakes. Fix them and your model becomes useful.
Get matched with vetted marketing experts in 48 hours
Tell us your role and stage. We surface 3 senior, vetted candidates within 48 hours. Free consultation, no commitment.
Get matched →